

|
|
|
|
|
Precision optical diagnostics
One of the important directions in the activities of the ND&O Division is precision optical metrology and development of methods of precision optical measurements. In recent years, IAP RAS researchers under the direction of I. E. Kozhevatov solved a number of problems in the field of high-precision registration of optical fields.
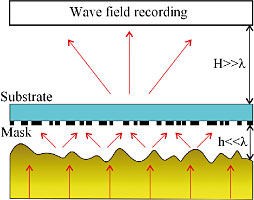
Point diffraction interferometer based on a single-mode optical fiber. An interference method for measuring optical fields from remote objects and external sources, in which a reference beam is obtained from a studied beam by filtering its spatial spectrum by a single-mode fiber is developed. This method of formation of a reference beam minimizes the impact of air fluctuations on the path of probe radiation on measurement accuracy. A new algorithm for reconstructing the phase of the interference pattern reduces significantly the influence on measurement accuracy of vibrations of the elements of interferometer optical scheme. To eliminate the impact on the measurement results of the phase errors caused by non-ideal elements of the optical scheme, a procedure for calibrating the interferometer was developed that permits determining errors and their further subtraction from the measured distributions of the field phase. The above mentioned developments allowed attaining nanometer accuracy in measuring the shape of remote optical elements and the phase of the wave fields from external sources. Optical raster method for subwavelength resolution imaging. A raster method for measuring a near-field structure and characteristics of surfaces with subwavelength spatial resolution was proposed. The method gives information about the structure of a sample simultaneously over the entire surface, providing much faster data acquisition than the traditional near-field scanning optical microscopy. The idea underlying the method is transformation of the near light field into propagating waves by a two-dimensional raster with subwavelength structure located in the immediate neighborhood of the surface under study. The structure of the surface is determined from measurements in the far field by conventional interferometry or microscopy. The method will allow obtaining three-dimensional images of biological objects and elements of future quantum computers with resolutions inaccessible to conventional optics. The method was tested in numerical experiments, a device for its experimental verification has been assembled.
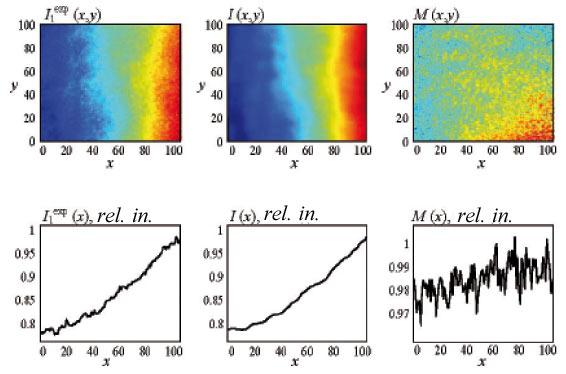
Calibration of the spatial distribution of the multielement photodetector sensitivity. Accurate recording of the spatial structure of optical radiation intensity is essential for precision optical metrology, particularly, in registering optical wave fields and in three-dimensional imaging. The main factor limiting measurement accuracy of spatial intensity distributions is spatial inhomogeneity of the sensitivity of light recording devices — CCD and CMOS photodetector matrices.
Results of the experiment on calibrating spatial distribution of CCD matrix sensitivity. Top — measured intensity distribution (x, y) (left); reconstructed intensity distribution I (x, y) (center) and photosensitivity (right) of CCD matrix M (x, y). Bottom — the corresponding one-dimensional distributions at fixed coordinate y. The x and y coordinates are elements of the matrix
|
||||||||||||||||||||||||||||||||||||||||||