

Geophysical
research
division
|
|
|
|
Geophysical
research
division |
|||
|
Laboratory of heterogeneous-media acoustics Acoustic spectroscopy of structurally heterogeneous natural media – the main method of precision acoustic measurements under laboratory conditions. In the early 2000s Andrey Lebedev proposed a scheme for acoustic measurements and data processing to obtain information on the elasticity and viscosity tensors of consolidated natural materials. As distinct from the conventional acoustic spectroscopy applications aimed at measuring the parameters of microscopic crystalline samples, in the case of heterogeneous natural media it is necessary to conduct measurements using samples with dimensions much larger than those of the structural irregularities, and the mechanical (acoustic) Q-factor of such materials is usually too low for determination of resonances (Q ∼ 10 2 is comparable with Q
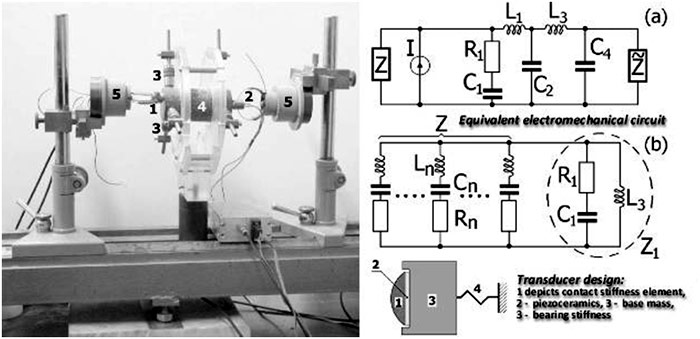
Fig. 1.2. On the left is a photo of the experimental setup for measuring the elasticity tensor of samples with masses ranging from a few hundred grams to several kilograms. On the right are the equivalent schemes showing the principle of operation of the setup. The proposed measuring scheme is shown in Fig. 1.2. The numbers on the left mark the transducers which excite oscillations (1) and record surface displacement (2) of the sample examined (4). Additional reference elements (3) are designed to relieve transducers (1) and (2). Elements (5) are the micrometer screws for precise positioning of the transducers. The design of the electromechanical transducer is shown in Fig. 1.2, lower right. The numbers denote (1) the element of contact stiffness Kc made of a soft material (caprolon), (2) piezoelectric ceramics, (3) supporting mass Mr, and (4) the element of supporting stiffness providing a static clamping of the transducer to the test specimen and a dynamic vibrational isolation of the sample oscillations from extraneous vibrations. In the electromechanical circuit (Fig. 1.2, top right), piezoelectric ceramics is the source of current (displacements) and the element Z1 is responsible for isolation from the vibrations of the reference elements of the construction (impedance Z). Operating frequencies are bounded from below by the frequency of the setting (contact) resonance (for the layout shown in Fig. 1.2, they are approximately 3 kHz) and are bounded from above by the frequency of the first resonance of the element’s distributed oscillations Mr (for the layout shown in Fig. 1.2, left they are approximately 100 kHz). The low contact stiffness combined with the vibrational isolation provide controlled small perturbation of the eigenfrequency spectrum and elimination of the resonance responses which are not associated with the test specimen oscillations.
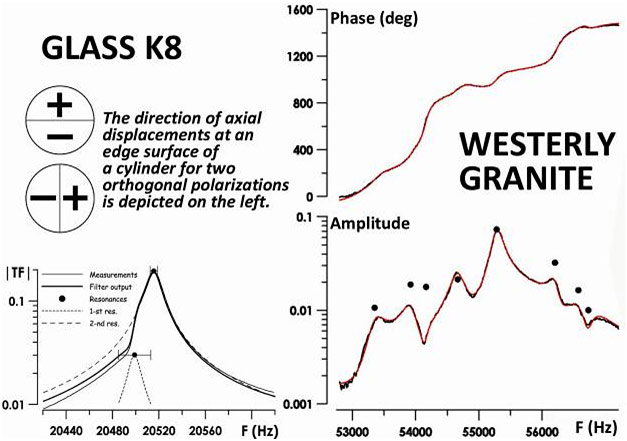
Figure 1.3. Example of matched filtering. Shown on the left is the data for optical glass branded K8. On the right is the data for granite Westerly (the black line is the experimental data and the red line corresponds to filtration. The symbols show the position of the resonance frequencies and the amplitudes of respective resonances). Examples of the experimental data and processing results are shown in Fig. 1.3. The Y-axis corresponds to the module of the transfer constant. As with any other method of processing which permits the achievement of a super-resolution, a priori information is used. In this case, a priori information is the assumption that the response of the sample is linear and the line shape is close to the Lorenz curve. For the extraction of resonances, one has to synthesize a filter, the input signal convolution (measurements data) with which leads to white noise at the output (no useful information). As a result of the absolute calibration implemented with the use of matched filtering, it was demonstrated that the elastic moduli can be measured with a relative error of 4·10−4. This value is close to the value specified by dissipation of physical dispersion of shear modulus G in glass (δG = 3·10−4 within the frequency range 20–75 kHz). The data in Fig. 1.3, right point to the possibility of extraction of resonance responses of a granite sample from [2] where the standard (with the usual resolution) processing techniques are not suitable.
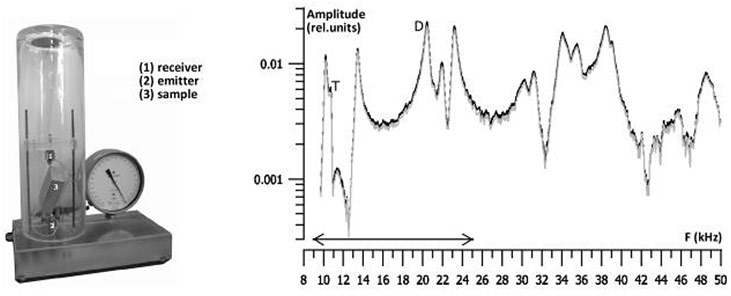
Figure 1.4. A photo of the experimental setup for a study of the effects of saturation with a liquid. On the right is a comparison of the measurements made at one-day intervals. In [8], the same setup (Fig. 1.4) was used to conduct a joint analysis of the acoustic spectroscopy data and measurements of the magnetic susceptibility of sedimentary and metamorphic rocks having a clear geological description. By agreement between the authors, the data on the geology and magnetic properties were not reported until the acoustic data were obtained. This excluded the subjectivity of the comparison. The observed correlation between the anisotropy of the elasticity tensor and the magnetic susceptibility indicates the role of the texture of the material and shows prospects for comprehensive geophysical research, including the analysis of acoustic characteristics and the characteristics of other physical fields.
To conclude this section, we give a comparison between the impulse and spectral methods of research (Table 1.1). We note the importance of the absence of the sample characteristics perturbation and the possibility of complex studies while using the method of resonance spectroscopy. In future we intend to examine the vibration effects on a fluid flow in porous media. At the same time, the measurements will include the use of non-acoustic methods. References to Section 1
|
|||||||||||||||||||||||||||||||||||||||||||||||